Showing posts with label Graphic. Show all posts

Tuesday, July 24, 2012

Housing Prices - Chennai, the most expensive city

After posting an article on Rental prices last week, I was looking at the owned property prices to check if there was any data available.  Reserve Bank through its owned subsidiary, National Housing Bank, has been  collecting statistics since 2001 but has folded them into an index called RESIDEX and has expanded the index to cover more cities starting 2007.  RESIDEX comes with a base of 100 in the year 2007.  Here is the graphic how the housing inflation has been since 2007.
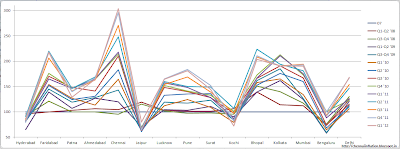
Graph of RESIDEX data


Chennai gets the recognition for the city with the highest inflation in housing prices since 2007.  The inflation is 200%.

If you have more data that you are aware of with respect to housing, please share with me your inputs. Thx.

Additionally there is current data for the following cities but there are no trends available.

City2007Q1 2012
Bhubaneshwar100161
Guwahati100157
Ludhiana100163
Vijayawada100184
Indore100208

Thursday, July 19, 2012

Consumer Price Index Jun 2012

The CPI (Consumer Price Index) numbers for June 2012...


TypeMay 2012Jun 2012
Consolidated10.3610.02
Urban11.5210.44
Rural9.579.74

Highlights (in brief):
  • Vegetables costlier by 27.60 percent
  • Edible oils by 16.58 percent
  • Milk products by 12.75 percent
  • Fruits by 6.92 percent

Here is the breakdown of CPI Data for Tamilnadu (The base is 100 in the year 2010)

Tamilnadu AttributeUrbanRuralCombined
Food, beverages and tobacco120.7120.9120.8
Fuel and light130.3132.4131.4
Clothing, bedding and footwear124.1125.4124.8
HousingNA122.0NA
Miscellaneous120.3117.0118.6
General Index121.6121.2121.4

It is interesting to compare the above with Puducherry's numbers given below.

Puducherry AttributeUrbanRuralCombined
Food, beverages and tobacco120.8120.9120.9
Fuel and light120.9117.4118.6
Clothing, bedding and footwear132.7126.7128.5
HousingNA117.9NA
Miscellaneous116.1115.5115.7
General Index120.0118.8119.1

If you are interested in numbers for other states, you can find it here.  The constituents of each attribute can be found in this document..

You can find the analysis of the CPI numbers on  Firstpost, Financial Express and many other newspapers.  Based on the numbers of CPI and WPI, it is not expected that the RBI to cut policy rates on the 31st of this month.  Hence your rates on loans is unlikely to come down anytime soon.


Background on CPI - The CPI index was only published starting January of 2012 and hence does not have much history associated with it.  There is a good analysis that you may be interested in.  

The RBI relies more on the WPI (Wholesale Price Index) number for its policy decisions (which includes the interest rates, CRR) currently.  The RBI's current perspective about inflation indices is echoed from the governor's recent speech: 
In its present structure, the WPI does not capture the price movement of services. Also, it is a hybrid of consumer and producer price quotes. For example, the index captures the price of important commodities like milk from the retail markets; not at the producer level. In contrast to CPI, PPI measures price changes from the perspective of the seller. Sellers’ and purchasers’ prices differ due to government subsidies, sales and excise taxes, and distribution costs. For these reasons, it is, therefore, desirable that we move towards developing a Producer Price Index (PPI) that measures the average change over time in the sale prices of domestic goods and services. 
Hoping that the central bank has the data in future to come up with the right policy rates.

Wednesday, July 18, 2012

Fuel Price Management


The magnitude of the twin deficits of current account deficit and fiscal deficit over time results in depreciation or appreciation of the rupee.  Since the crude prices are marked against the dollar and when the rupee/dollar rate fluctuates, the import price of crude oil is higher.

For simplistic reasons, I have multiplied the crude oil price on a given day against the forex rate for that day. I have not considered the indian basket price as well.  Just for analysis, I present the complete graph of petrol, diesel (marked on the left y axis in Rs.) and the product of crude and exchange rate (barrel price in Rs. on the right y axis) for the last 10+ years.  The following chart (click for a larger display) is a very good illustration of how the fuel price has been managed by the government of the day as well as the oil companies.


A few things stand out:
  • Ratio of Petrol/Crude rise to Diesel/Crude rise is a big concern (That is the subsidy given)
  • The Ratio of crude rise to Petrol rise is more than 1 (Were the oil companies making lot of money in the 2002-2011 timeframe?)
A big thanks to MyPetrolPrice, X-rates & EIA for the various data used in this chart.

Why is solving Indian's inflation crisis so important?

The following graph gives you the trend of inflation in India in the past 10+ years. Inflation has been unsustainable during the past few years. CPI is the Consumer Price Index. CPI data is released every month and I hope to update it on this blog when it is released.


Read Why is solving India's Inflation crisis so important? to understand why it is so important to solve the problem.